Transforming Data
into Decision
Even after a redesign, only 30% of people were actually using it. I took over to completely fix the Mastercard TI experience and built the new TI Plus from scratch. By fixing the frustrating parts that everyone hated, I turned a clunky old tool into a powerful data system that pro users finally love to use.
4 months
Lead product designer
B2B Web App
Global market
User Adoption
123% Increase in Migration
Successfully transitioned users from legacy systems to the new platform by restoring workflow efficiency and data density
Task Efficiency
93% Faster Investigation
Streamlined complex search architectures and navigation, reducing cognitive load for high-volume investigators
Business Growth
New Premium Revenue Stream
Architected the 'TI Plus' tier from scratch, enabling advanced analytics and visualization as a revenue-generating service.
THE PROBLEM
Why Only 30%?
Uncovering the Barriers to Adoption
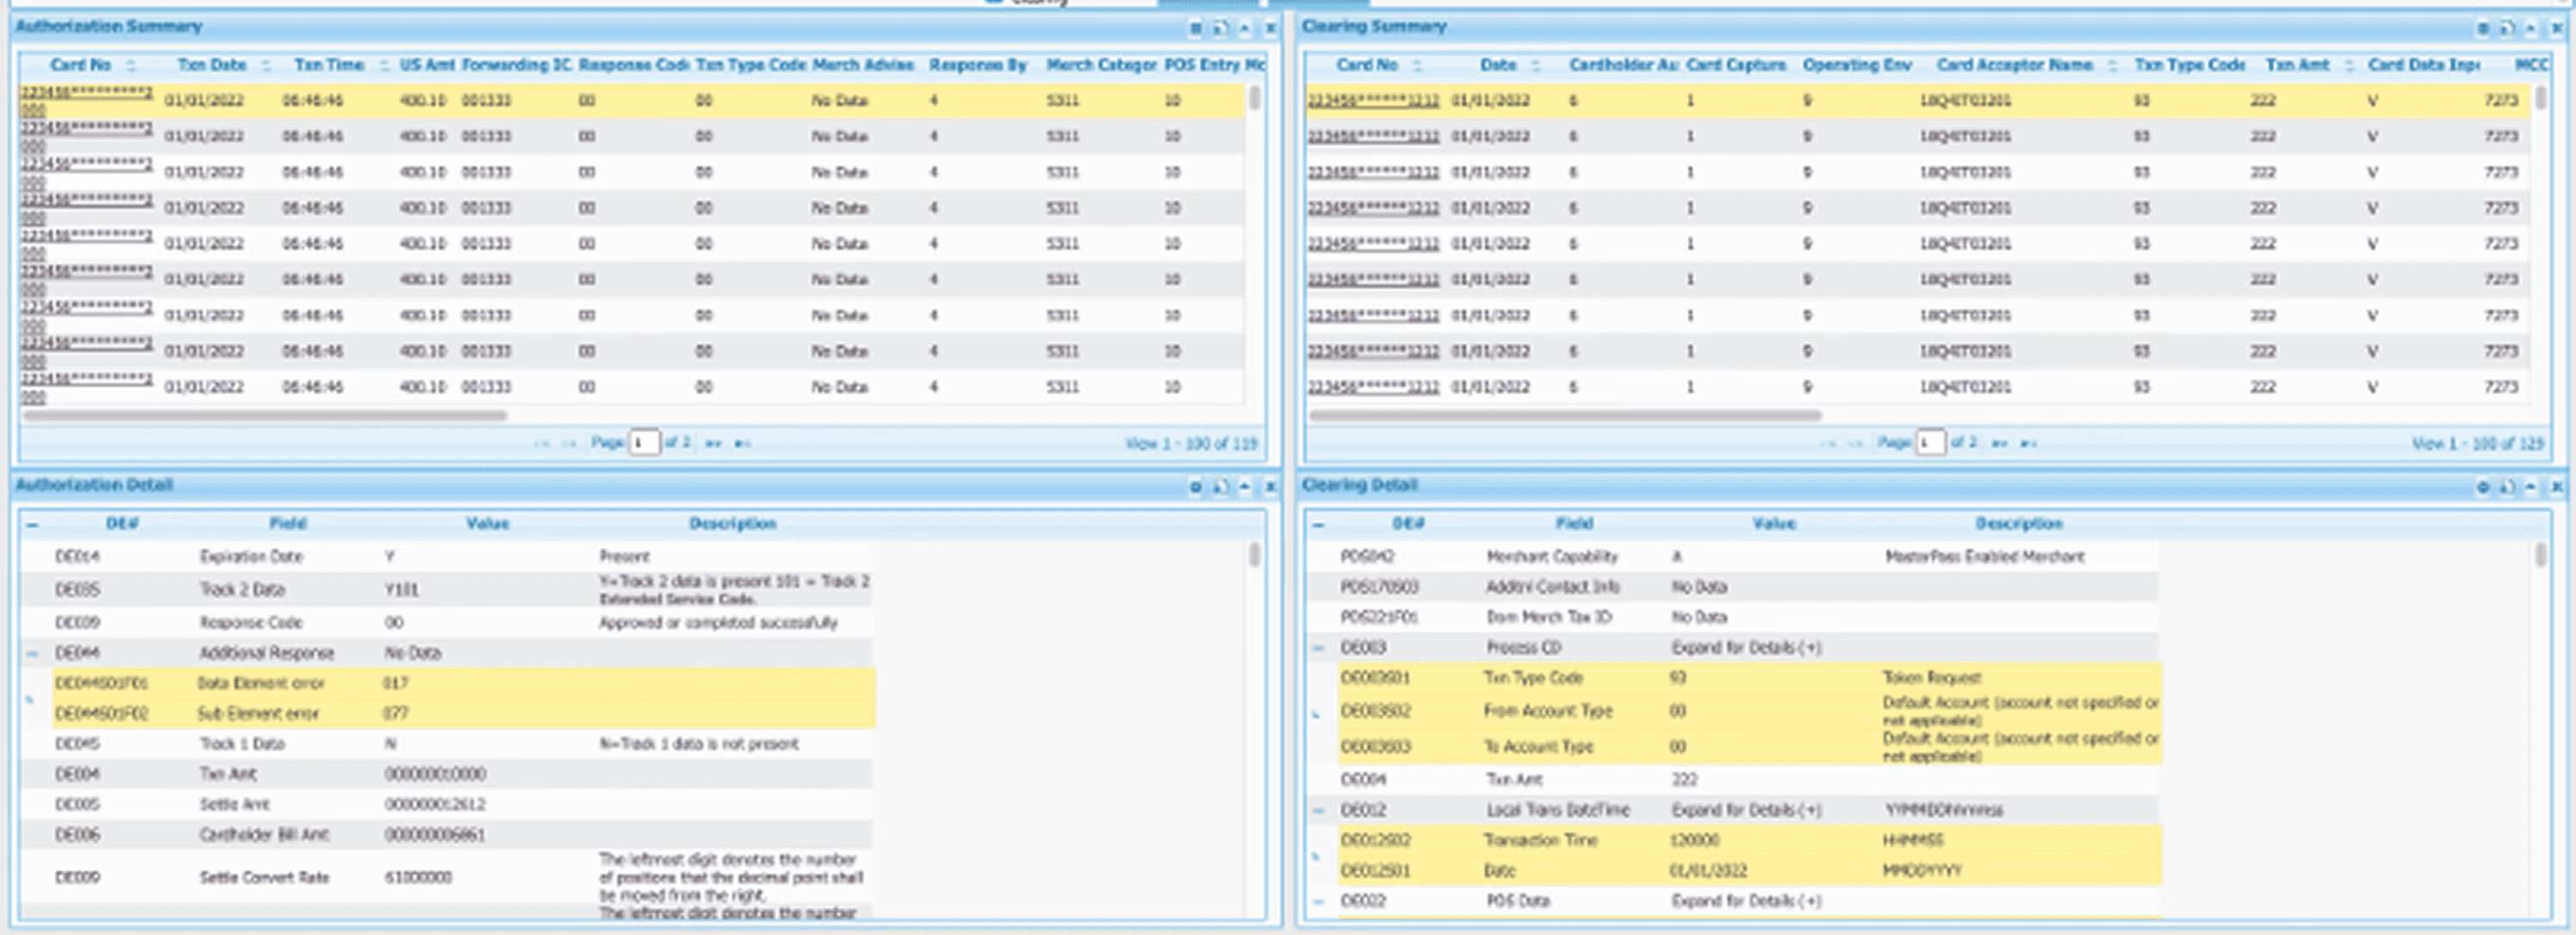
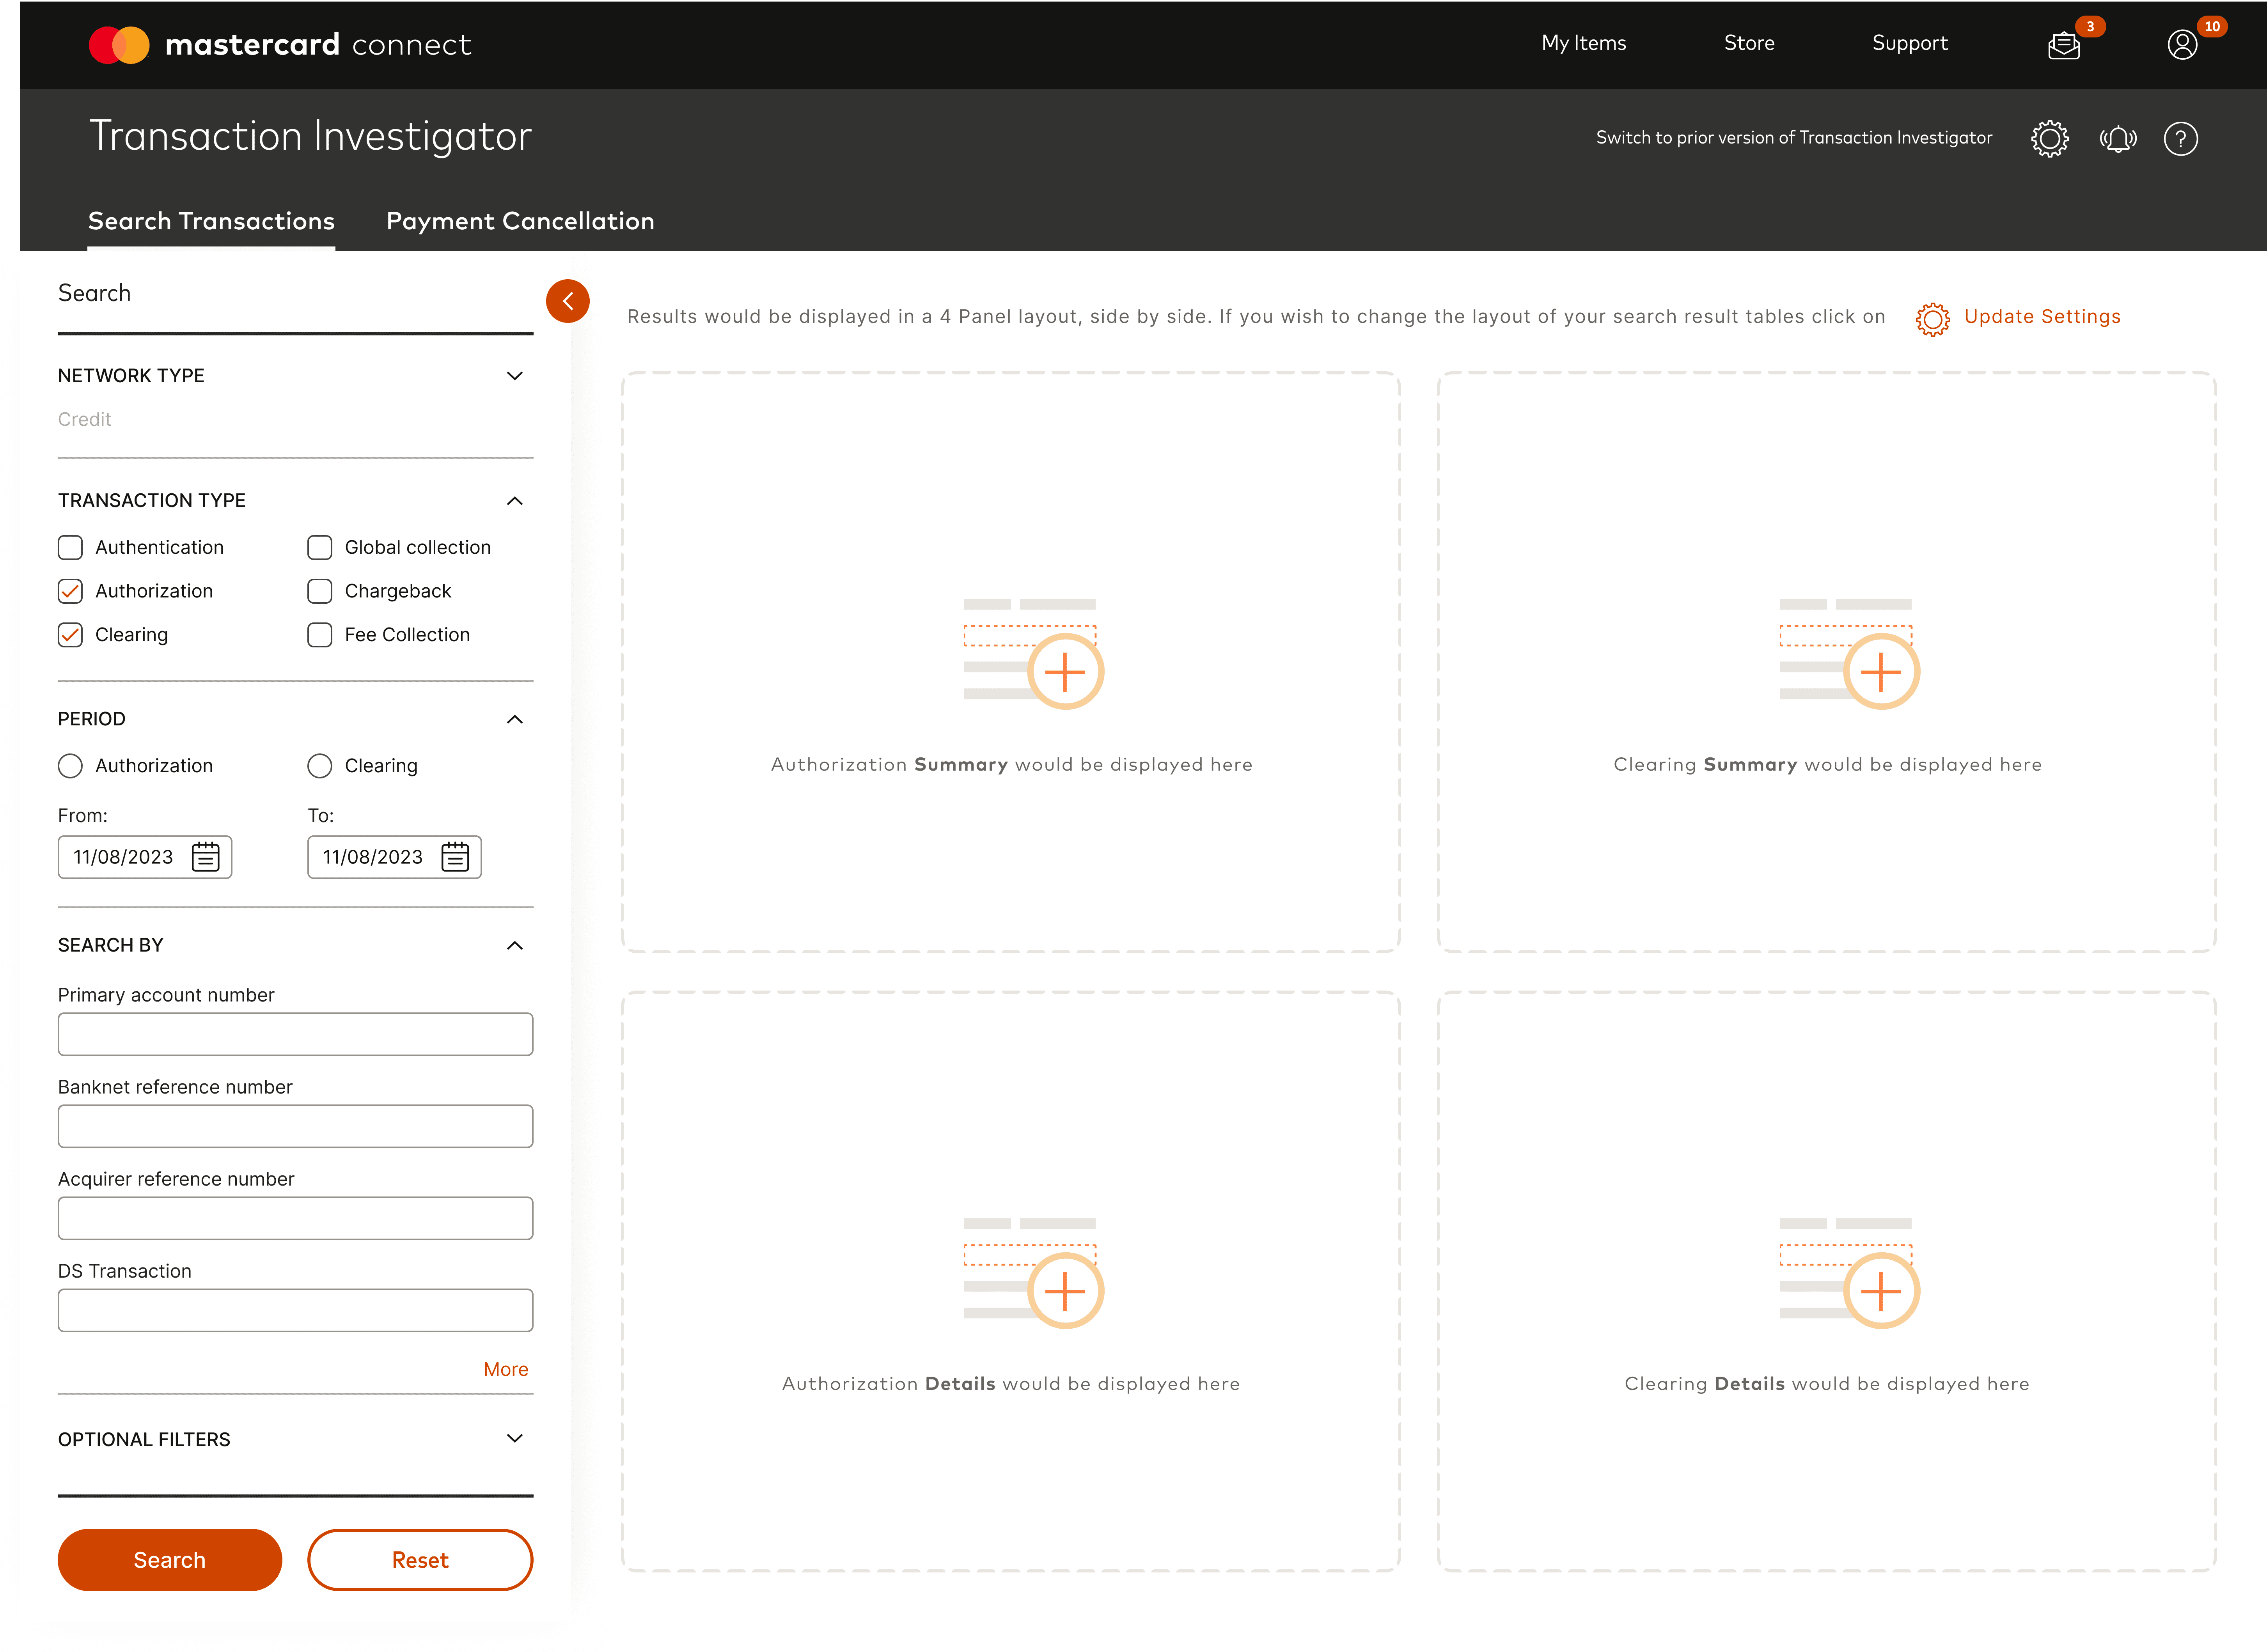
The initial redesign optimized for a 'clean' look based on general UX standards, but overlooked the extreme efficiency actual users required. Without direct research, generous spacing was applied for readability, which inadvertently slowed down workflows by diluting the high-density data essential for high-speed analysis.
Legacy system (Old)
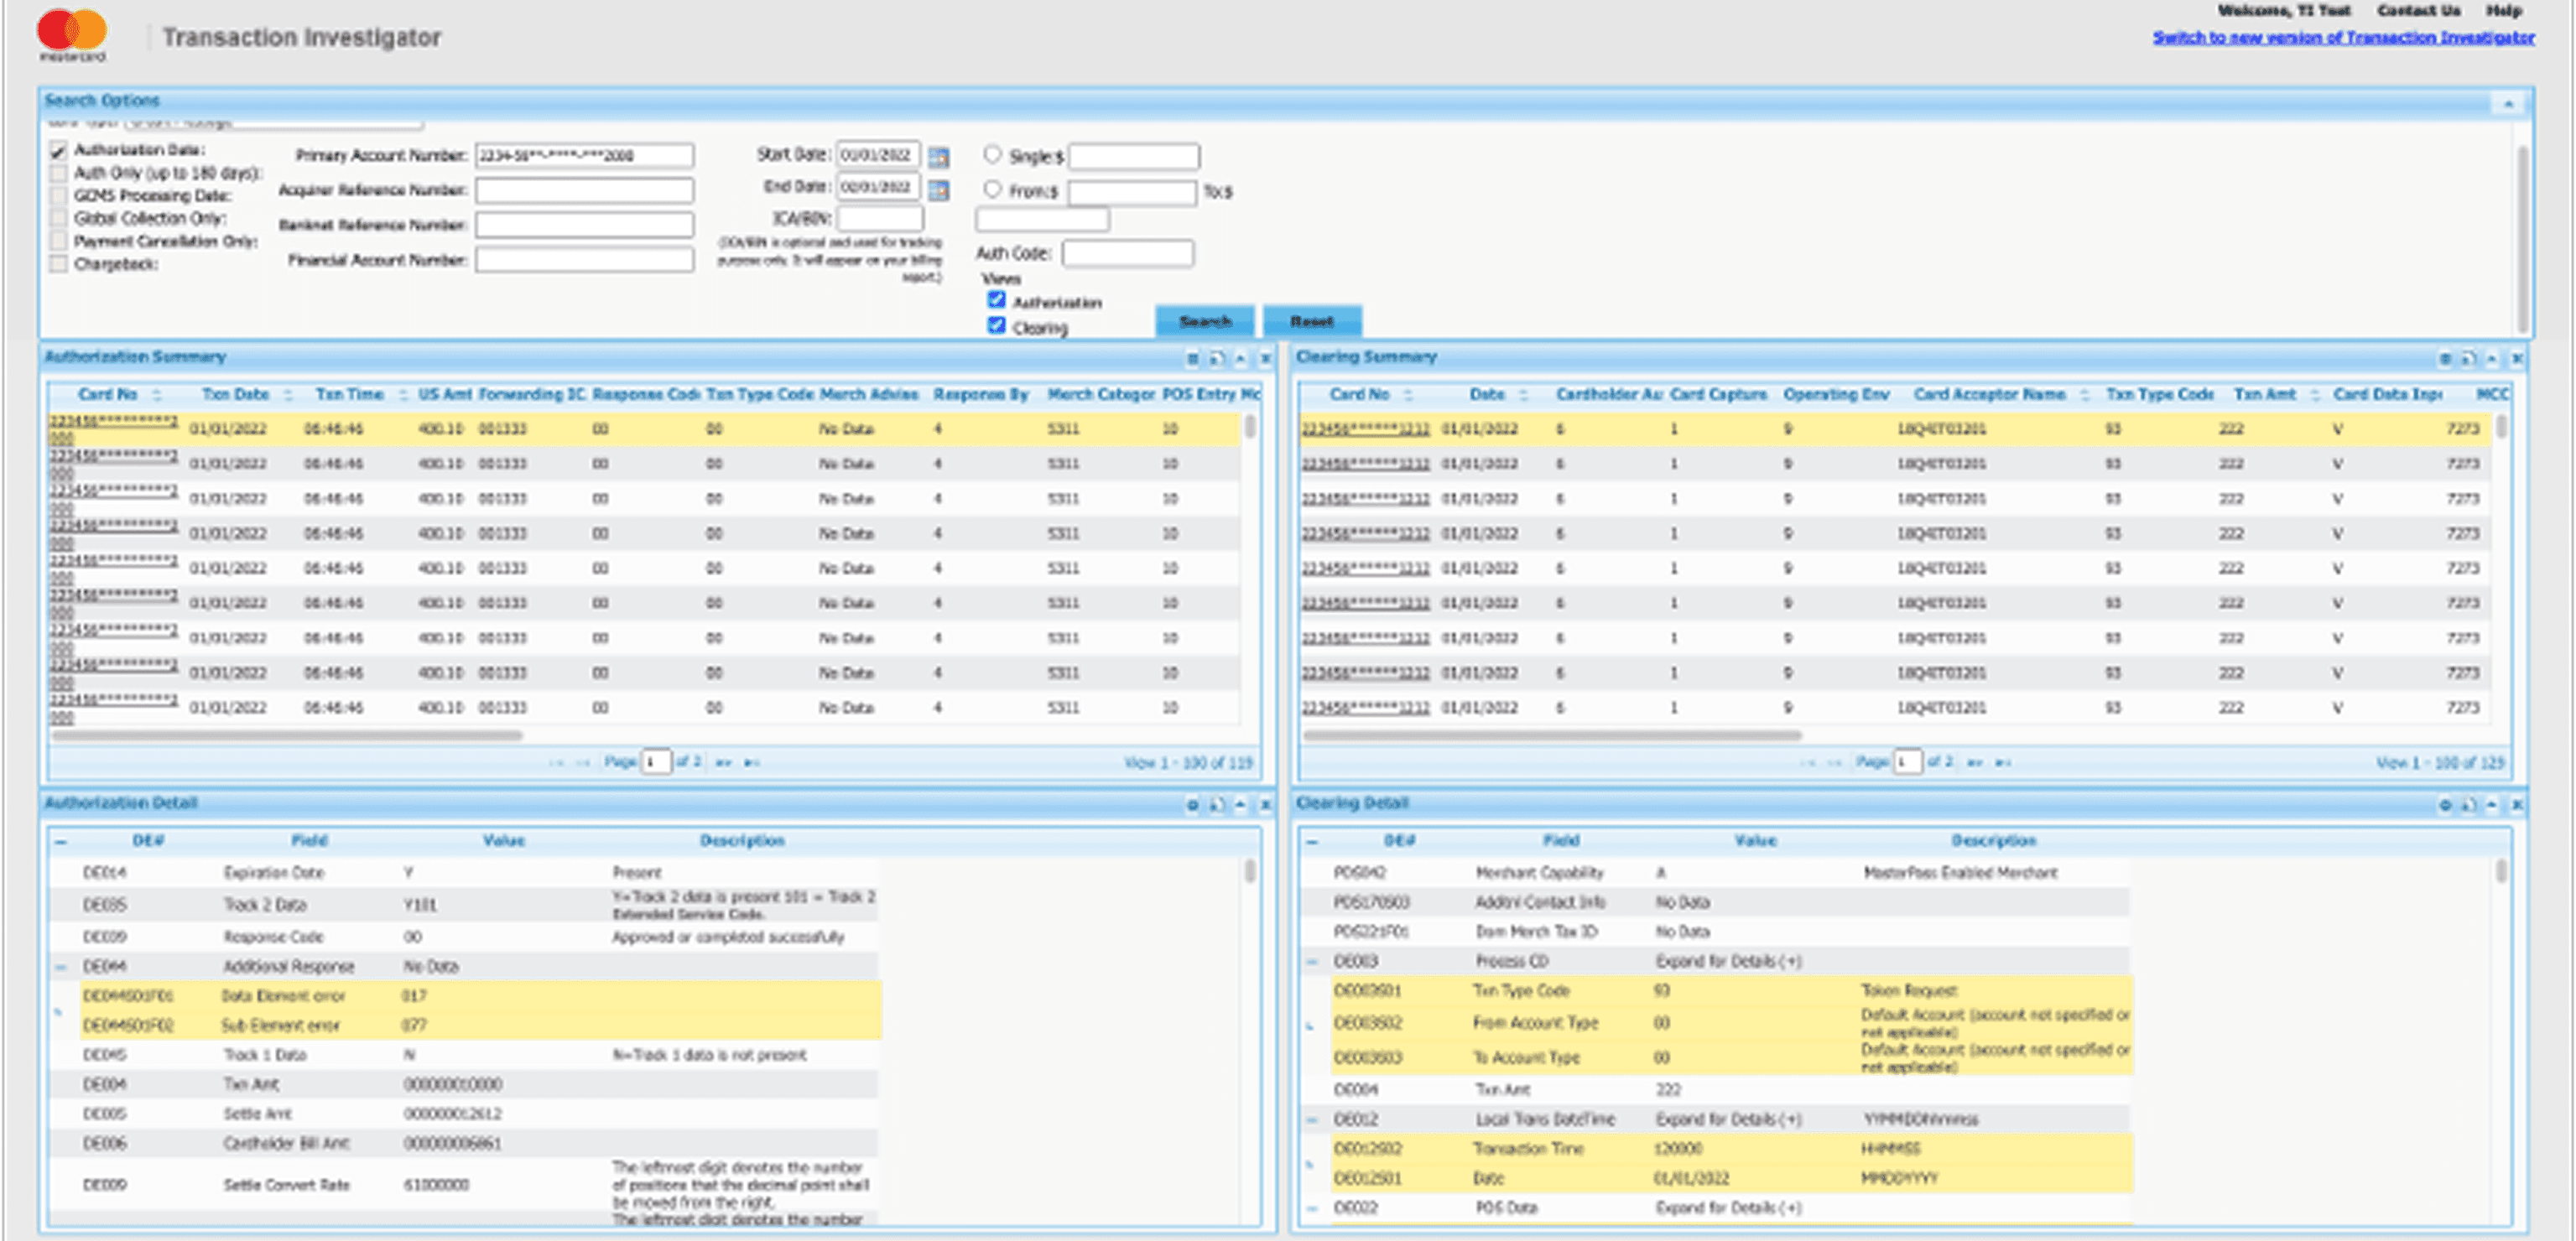
Outdated but Optimized for Actual Workflows
Initial Launch (Problematic New UI)

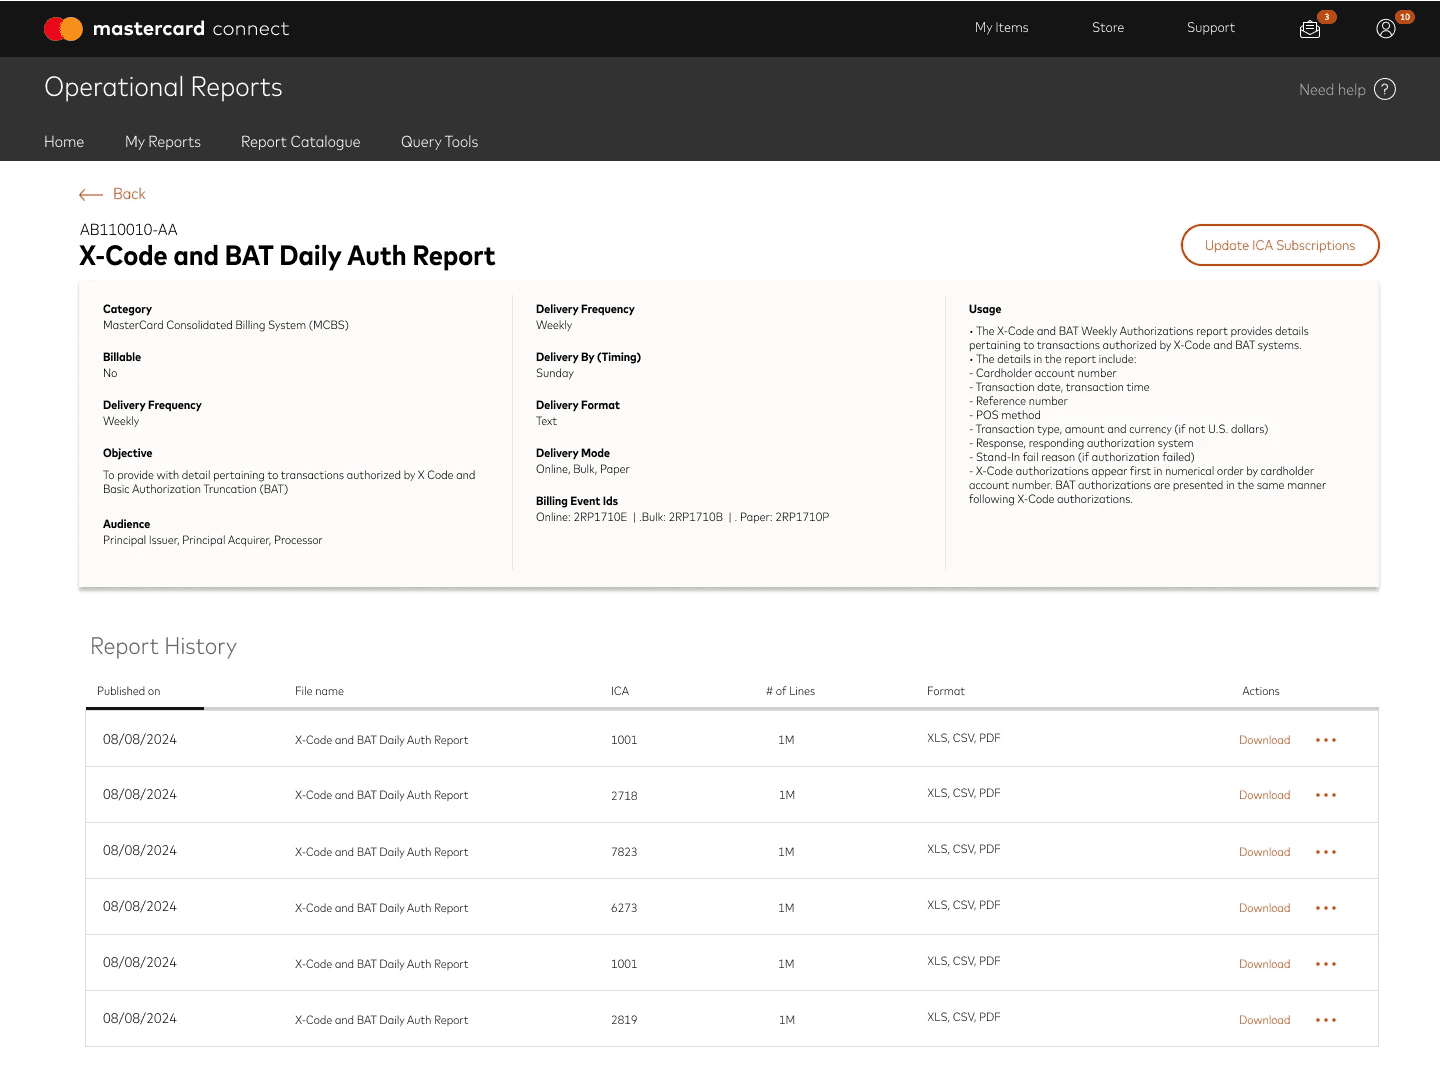
Modern Standards, yet Misaligned with User Needs
Three Core Barriers to Efficiency
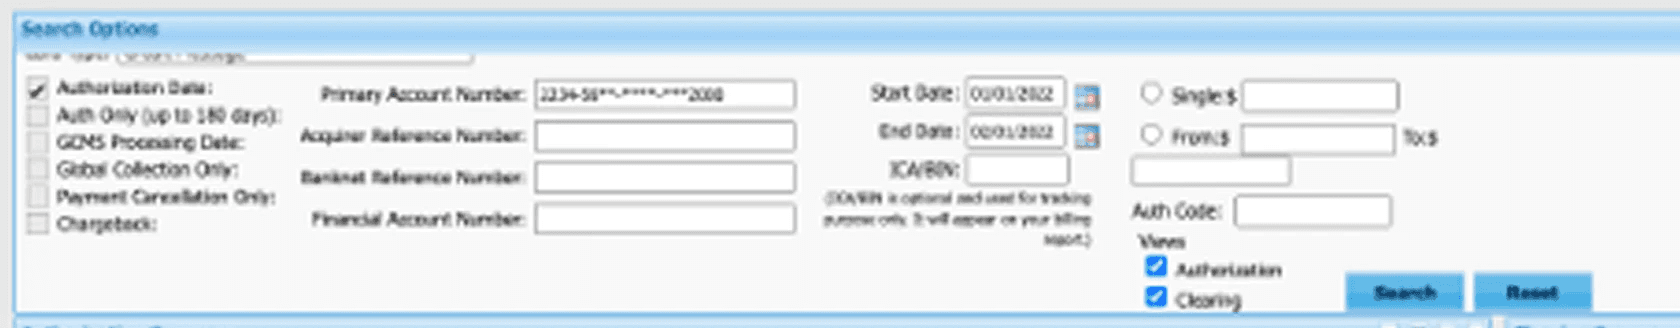
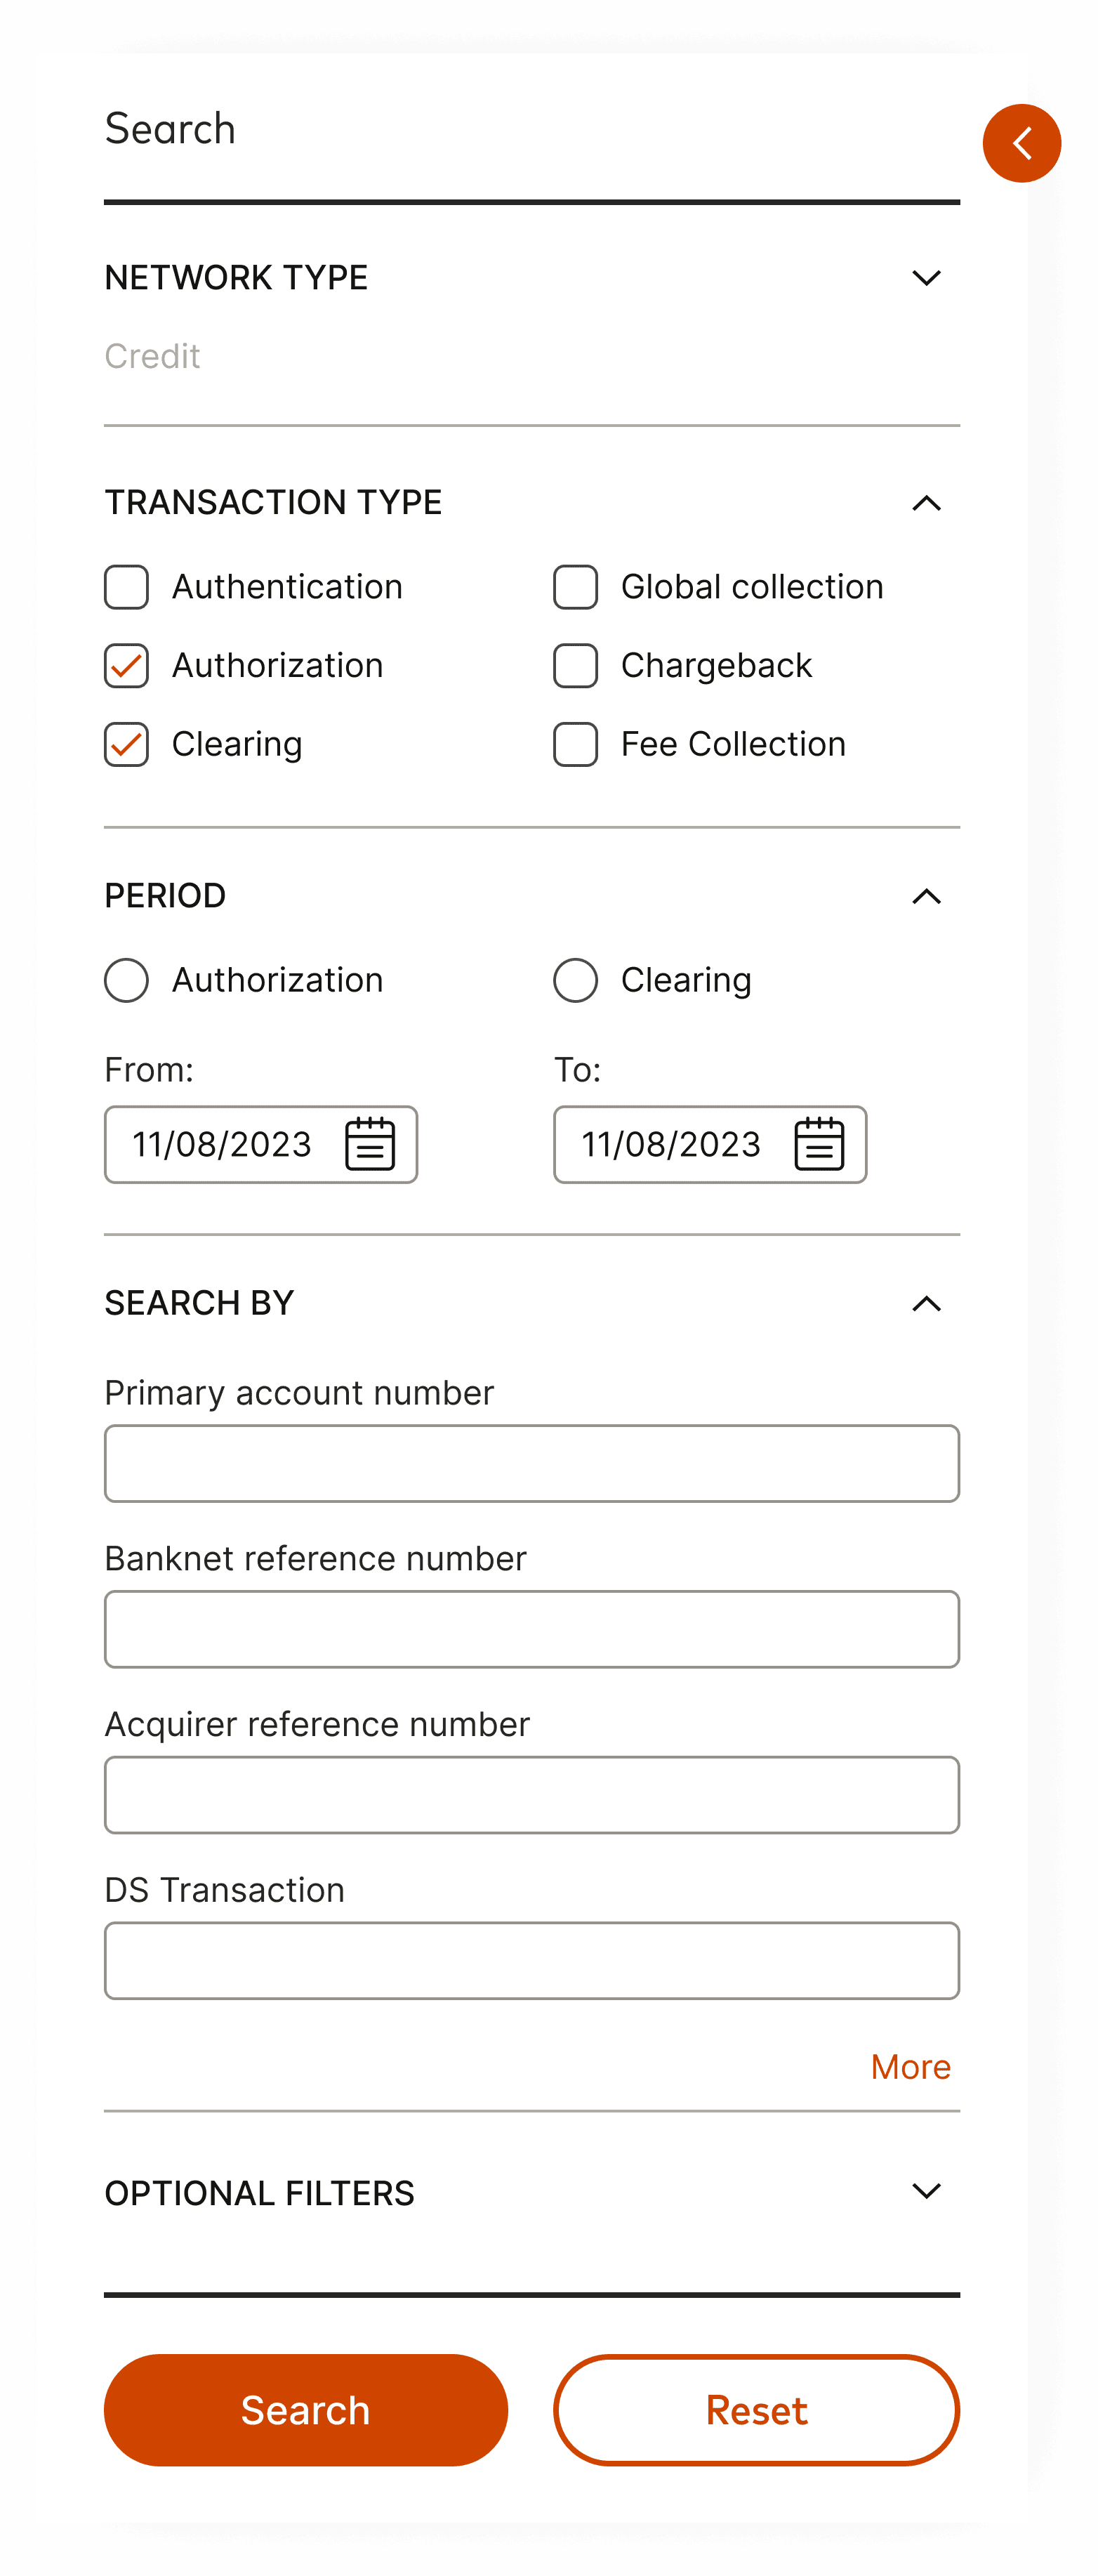
Scattered input fields

Search Flow Inefficiency
Vertical scrolling for search parameters hindered rapid setup and blocked an at-a-glance view.

Fragmented Data View
Fragmented views forced frequent context switching, hindering efficient data comparison.

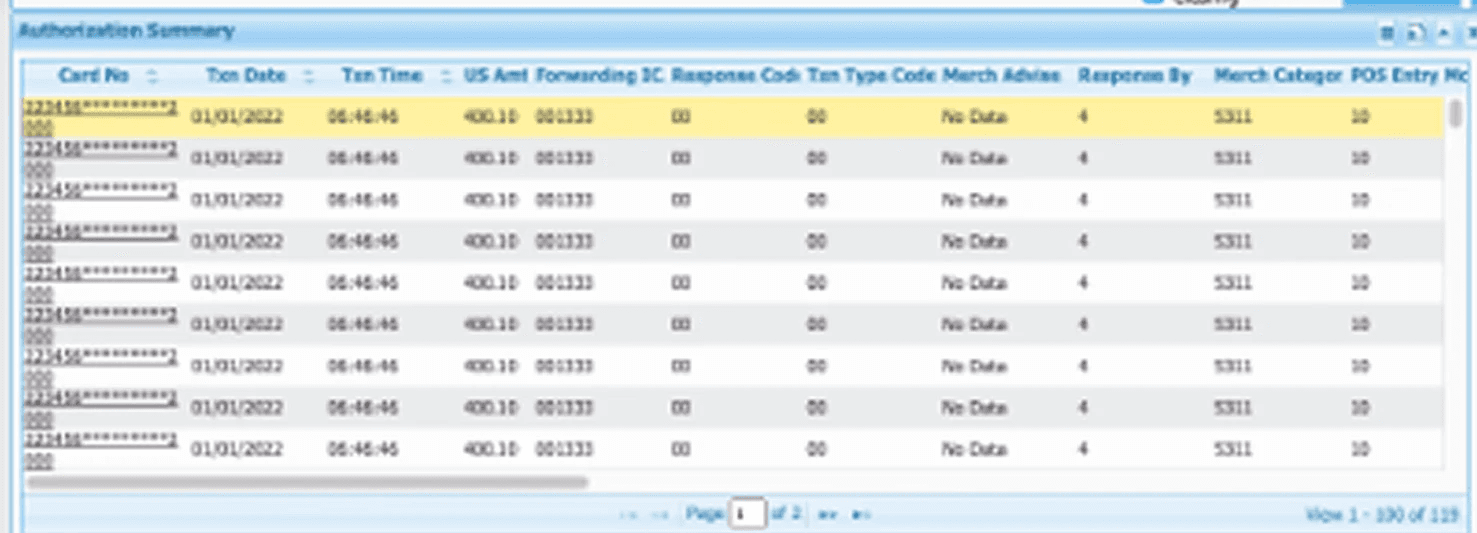
Inefficient Spatial Usage
Excessive spacing scattered data, forcing constant scrolling and blocking a quick overview.

Scroll-bound
parameters

Repetitive
back-and-forth
Wasted white space
Buried data
KEY INSIGHT:
High-speed analysis requires a new balance between modern UI and legacy density.
THE STRATEGIC DESIGN APPROACH
Audit, Segmentation, Discovery
To transform a fragmented legacy system into a scalable intelligence platform, I established a three-step strategic approach focused on data integrity and user-centric discovery.


PHASE 1: THE FOUNDATION (TI BASIC)
Restoring Trust through Efficiency
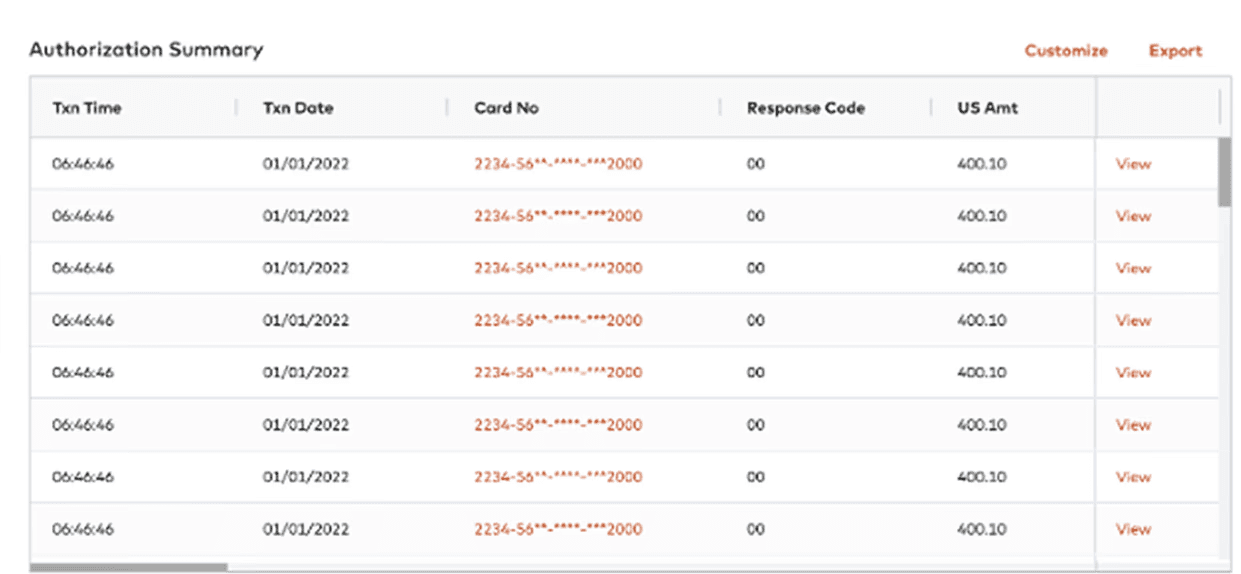
For the core product, I re-engineered the foundational UI to handle inherently complex and high-volume datasets. By prioritizing functional density through a tightened grid architecture and an optimized table system, I restored the rapid scannability required for daily operations. This foundational success stabilized the user base and drove a 123% increase in user migration.
02
03
01
EFFICIENCY
01
Optimized Parameter Logic
Prioritized frequently used parameters and grouped them logically to maximize search efficiency within the existing vertical bar.
USABILITY
02
Instant Filter Review
Implemented a top summary bar to allow instant review and adjustment of filters without the friction of reopening panels.
CONFIGURATION
03
Tailored Viewing Experience
Enabled customizable settings for table layouts and font sizes, allowing users to optimize their workspace based on specific tasks.
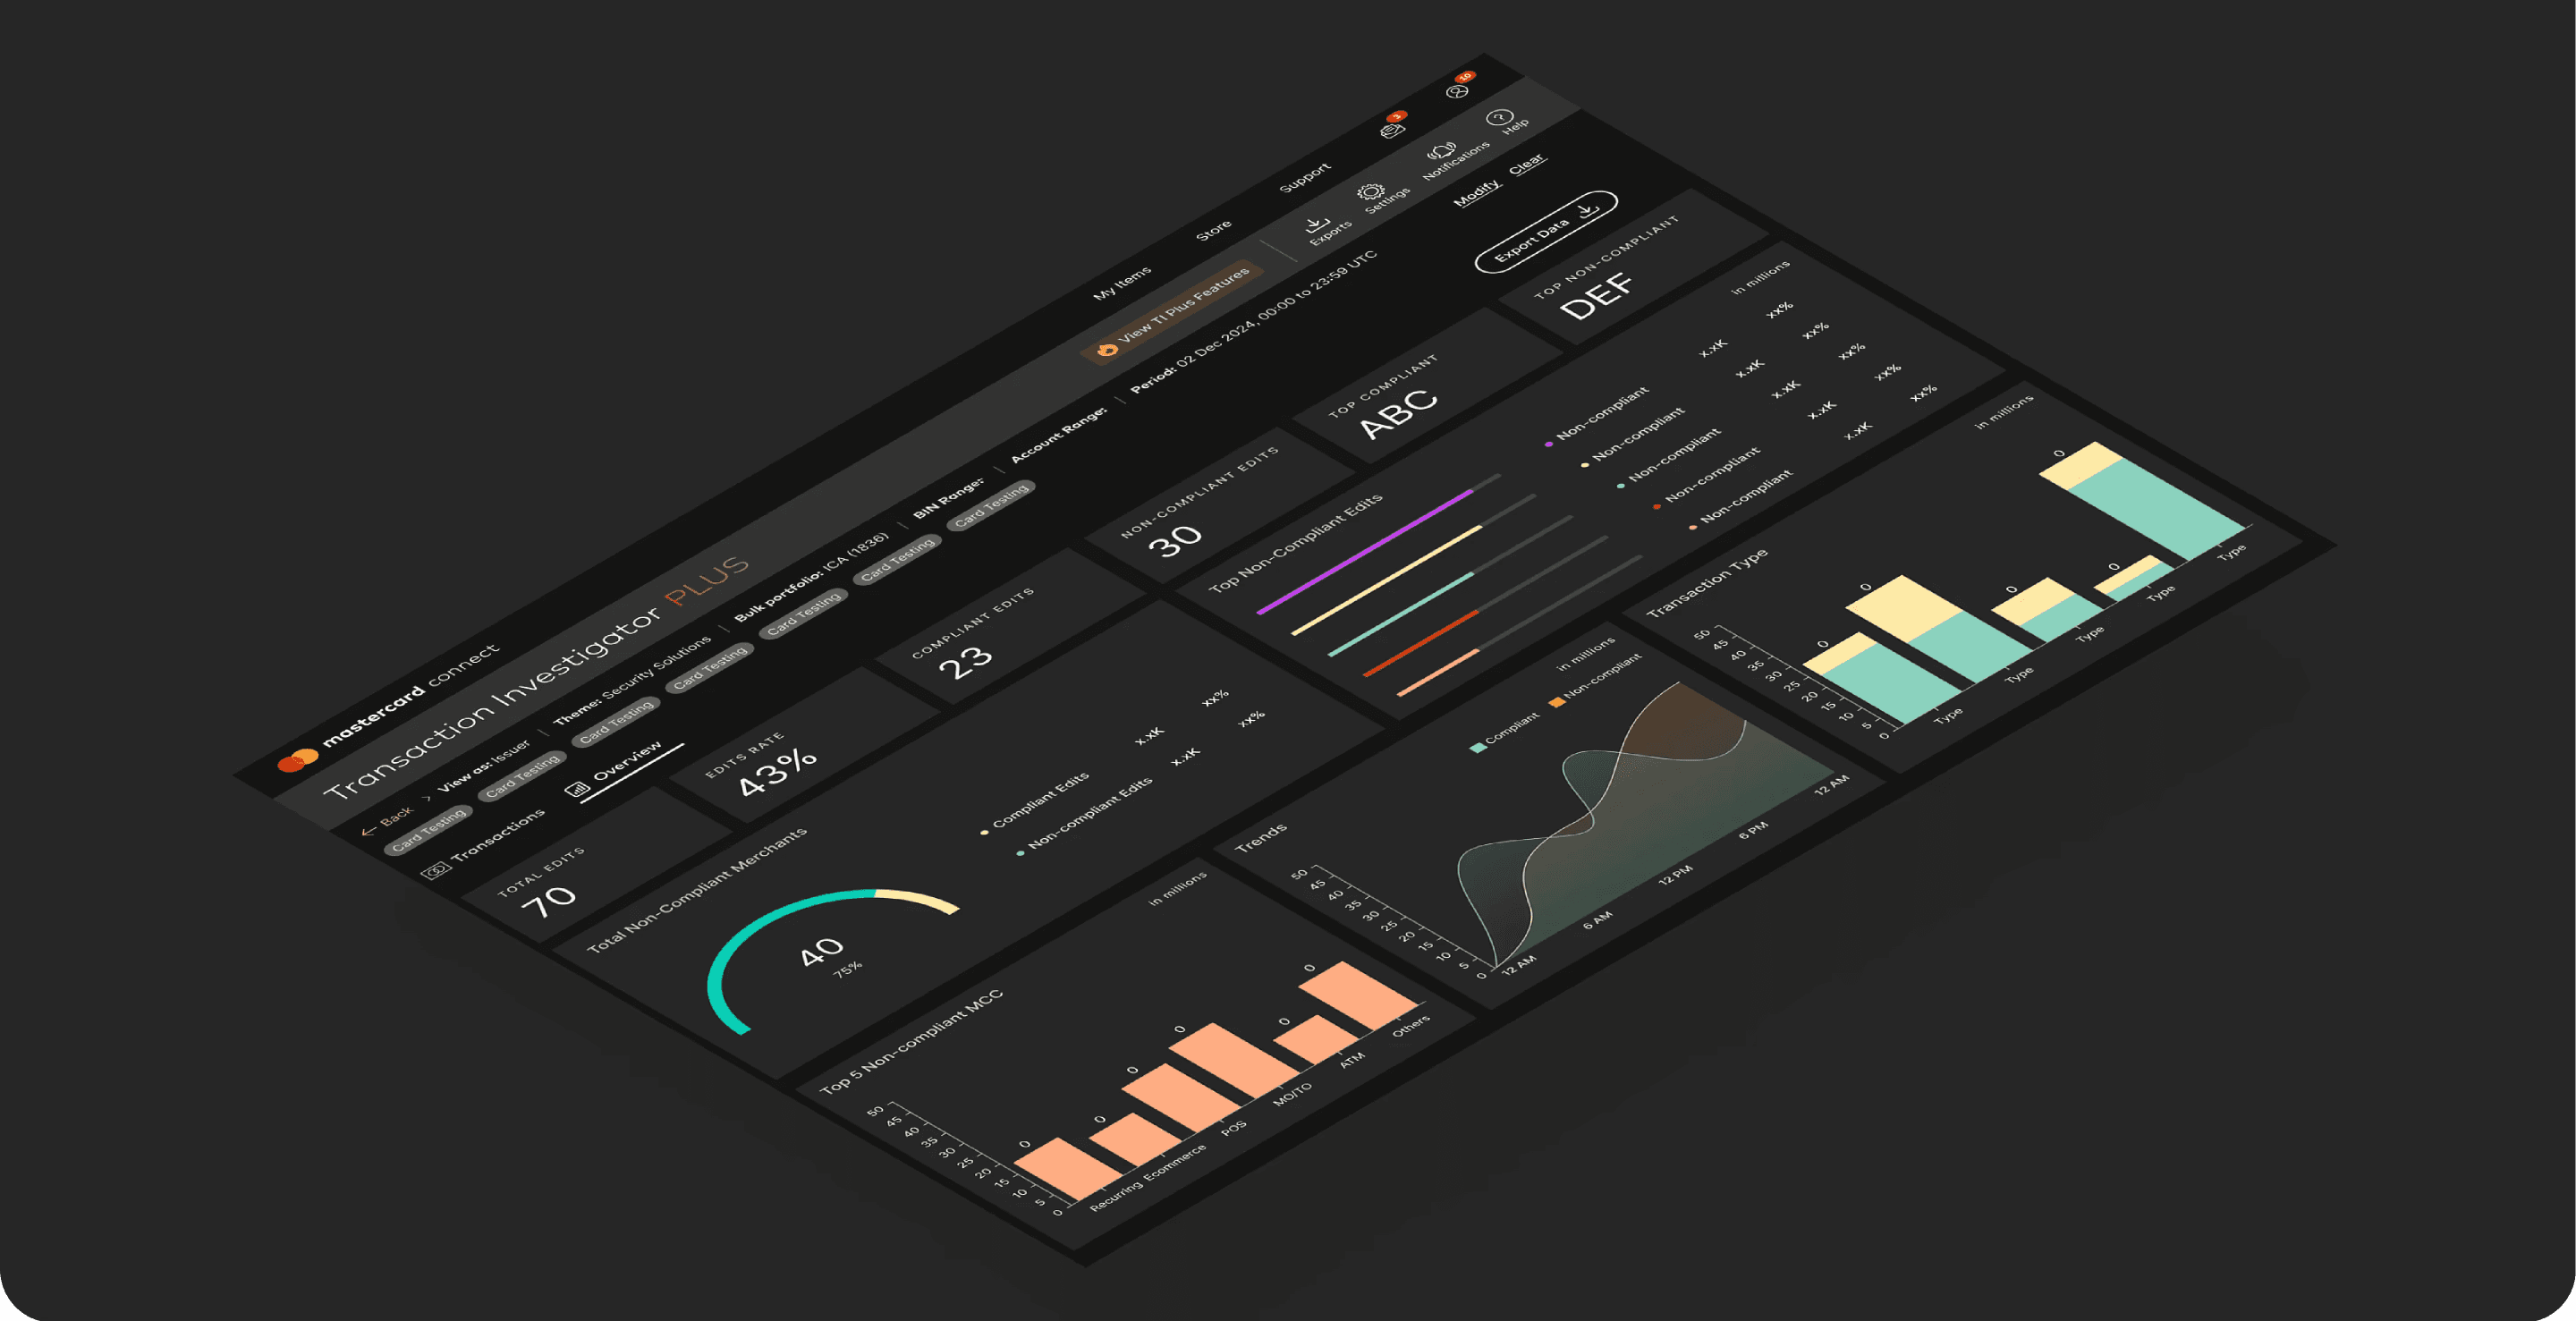
PHASE 2: THE TI PLUS EXPERIENCE
TI PLUS: Advanced Search Flow
and Visual System
"Optimizing the search experience through a new data structure and dark-themed interface."
For TI Plus, I engineered a new data structure to handle complex search flows at scale. I focused on translating massive search results into intuitive data visualizations, all wrapped in a refined dark theme to maximize focus and minimize cognitive load for professional users.
ADVANCED SEARCH ARCHITECTURE
Integrating Premium Tiers
I designed a new data structure to simplify complex, bulk-level search flows. This strategic foundation allows professional users to filter massive datasets with precision and view results through intuitive data visualizations.
Select TI Plus tab
Premium activation
New Search
Login TI App
Unified service access
Select Portfolio
Targeted data sets
Select Theme
Multi-layer filtering
Overview Graphs & Transaction List
Based on filters
Real-Time Analytics
Advanced Search Architecture
Pre-calculated search parameters designed for each theme to filter millions of records with surgical precision.

Data Visualization
Visualized Search Outcomes
Dynamic Data Visualization that transforms filtered results into clear, actionable intelligence.

TI PLUS: THE SELECTED EXPERIENCE.


01. HIGH-PRECISION SEARCH LOGIC


02. TAILORED DATA ARCHITECTURE


03. MULTI-DIMENSIONAL DATA VISUALIZATION
THE OUTCOME
From Data Management to Actionable Intelligence
The Result Redefining Data Efficiency. I transformed complex transaction data into a streamlined, intuitive search experience. The result is a high-performance system that minimizes cognitive load and maximizes professional focus.
IA,